PDF VersionÂ
Patricia N. Pastor, Ph.D.; Cynthia A. Reuben, M.A.; Catherine R. Duran, B.S.; and LaJeana D. Hawkins, M.P.H., C.H.E.S.
Attention deficit hyperactivity disorder (ADHD) is the most common neurobehavioral disorder diagnosed in U.S. children (1). While this disorder is most often diagnosed in children when they are in elementary school, it is increasingly being identified in preschool children (2–5). This report describes the prevalence of diagnosed ADHD among children aged 4–17 years using parent-reported data collected in a large, nationally representative health survey. Differences in the prevalence of diagnosed ADHD are examined by selected demographic and socioeconomic variables: the child’s sex, race and Hispanic ethnicity, health insurance coverage, and poverty status for all children aged 4–17 and among age groups 4–5, 6–11, and 12–17.
Keywords: child mental health, behavioral disorders, National Health Interview Survey
Figure 1. Children aged 4–17 years with diagnosed ADHD, by age and sex: United States, 2011–2013
1Significantly different from girls within the same age group (p < 0.05).
2Significantly different from all children aged 6–11 (p < 0.05).
3Significantly different from all children aged 12–17 (p < 0.05).
4Significantly different from children of the same sex aged 6–11 (p < 0.05).
5Significantly different from children of the same sex aged 12–17 (p < 0.05).
NOTES: Data are based on household interviews of a sample of the civilian noninstitutionalized U.S. population. ADHD is attention deficit hyperactivity disorder.
SOURCE: CDC/NCHS, National Health Interview Survey, 2011–2013.
In 2011–2013, the overall prevalence of ever diagnosed ADHD in children aged 4–17 was 9.5% (Figure 1). The prevalence of diagnosed ADHD was higher among older children than younger children: 2.7% among children aged 4–5, 9.5% among children aged 6–11, and 11.8% among children aged 12–17.
Among all children aged 4–17 and within each age group, boys were more than two times as likely to have ever been diagnosed with ADHD compared with girls. Boys and girls aged 4–5 were less likely to have ever been diagnosed with ADHD compared with older boys and girls.
The prevalence of diagnosed ADHD among boys aged 6–11 was lower than the prevalence among boys aged 12–17 (13.2% compared with 16.3%). The prevalence of diagnosed ADHD among girls aged 6–11 was also lower than the prevalence among girls aged 12–17 (5.6% compared with 7.1%).
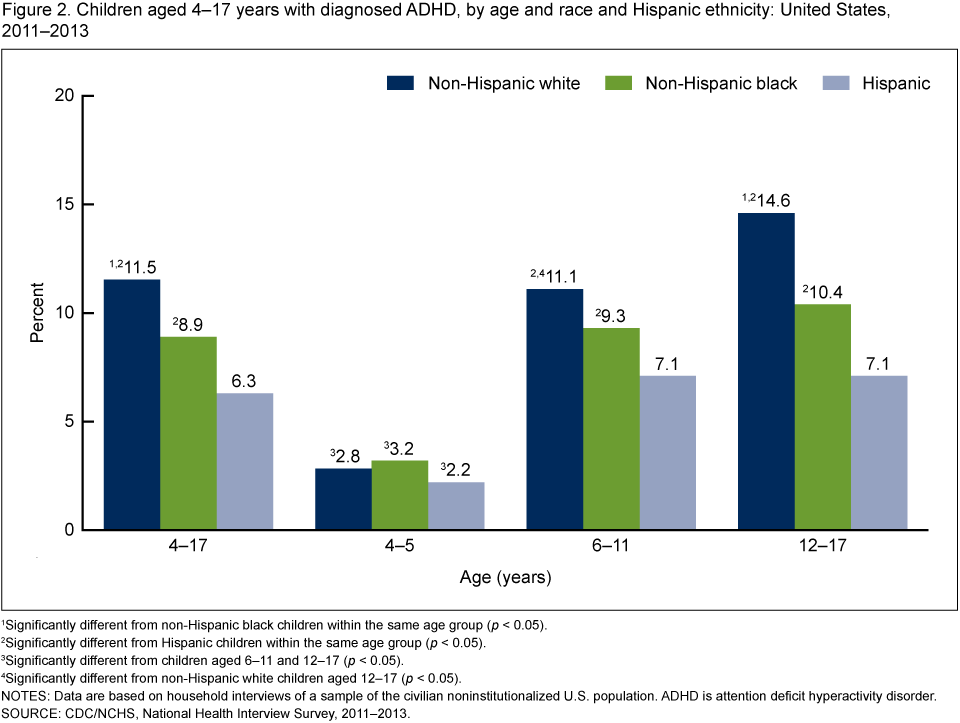
Figure 2. Children aged 4–17 years with diagnosed ADHD, by age and race and Hispanic ethnicity: United States, 2011–2013
1Significantly different from non-Hispanic black children within the same age group (p < 0.05).
2Significantly different from Hispanic children within the same age group (p < 0.05).
3Significantly different from children aged 6–11 and 12–17 (p < 0.05).
4Significantly different from non-Hispanic white children aged 12–17 (p < 0.05).
NOTES: Data are based on household interviews of a sample of the civilian noninstitutionalized U.S. population. ADHD is attention deficit hyperactivity disorder.
SOURCE: CDC/NCHS, National Health Interview Survey, 2011–2013.
In each racial and ethnic group, the prevalence of diagnosed ADHD among children aged 4–5 was lower than the prevalence among older children. There were no statistically significant differences in the prevalence of diagnosed ADHD among non-Hispanic white, non-Hispanic black, and Hispanic children in this age group.
Among children aged 6–11, non-Hispanic white (11.1%) and non-Hispanic black (9.3%) children were more likely than Hispanic children (7.1%) to have ever been diagnosed with ADHD (Figure 2). The prevalence of diagnosed ADHD among non-Hispanic white and non-Hispanic black children did not differ significantly.
Among children aged 12–17, non-Hispanic white (14.6%) and non-Hispanic black (10.4%) children were more likely than Hispanic children (7.1%) to have ever been diagnosed with ADHD. In this age group, non-Hispanic white children were more likely than non-Hispanic black children to have ever been diagnosed with ADHD.
Among non-Hispanic white children, the prevalence of diagnosed ADHD was higher among those aged 12–17 than among those aged 6–11: 14.6% compared with 11.1%. However, the prevalence of diagnosed ADHD among non-Hispanic black and Hispanic children did not differ significantly between those aged 6–11 and 12–17.
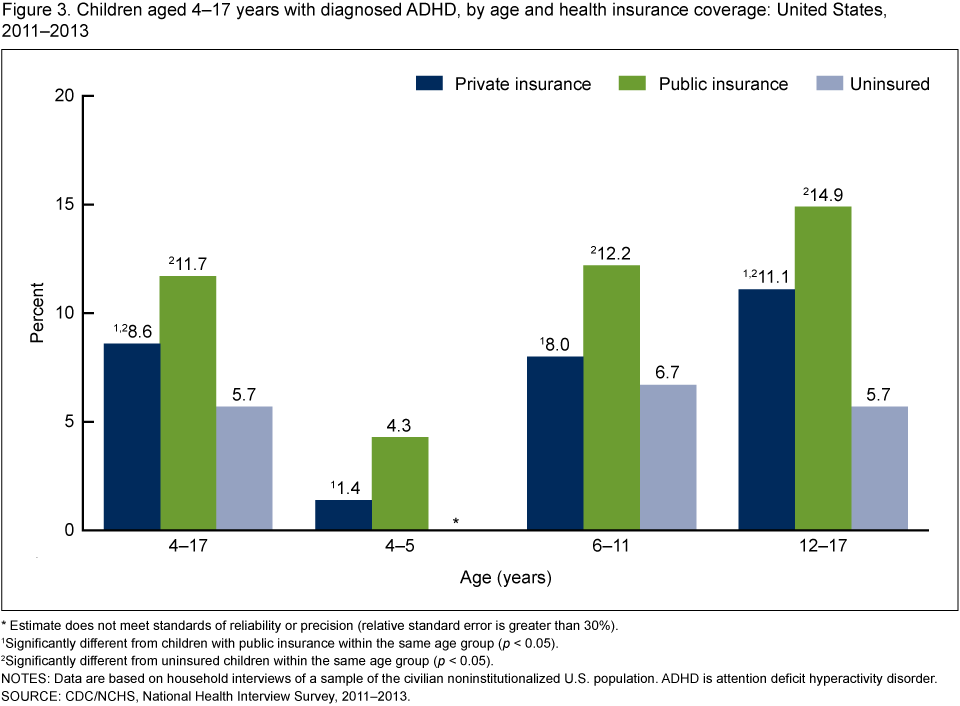
Figure 3. Children aged 4–17 years with diagnosed ADHD, by age and health insurance coverage: United States, 2011–2013
* Estimate does not meet standards of reliability or precision (relative standard error is greater than 30%).
1Significantly different from children with public insurance within the same age group (p < 0.05).
2Significantly different from uninsured children within the same age group (p < 0.05).
NOTES: Data are based on household interviews of a sample of the civilian noninstitutionalized U.S. population. ADHD is attention deficit hyperactivity disorder.
SOURCE: CDC/NCHS, National Health Interview Survey, 2011–2013.
Among children in each age group, the prevalence of diagnosed ADHD was higher among children with public insurance than among children with private insurance. Among those aged 4–5, 4.3% of children with public insurance had ever been diagnosed with ADHD compared with 1.4% of children with private insurance (Figure 3). Among children aged 6–11, 12.2% of children with public insurance had ever been diagnosed with ADHD compared with 8.0% of children with private insurance. And among children aged 12–17, 14.9% of children with public insurance had ever been diagnosed with ADHD compared with 11.1% of children with private insurance.
Among children aged 6–11 and 12–17, the prevalence of diagnosed ADHD was lower among uninsured children than among children with public health insurance. Among those aged 6–11, 12.2% of children with public insurance had ever been diagnosed with ADHD compared with 6.7% of uninsured children. Among those aged 12–17, 14.9% of children with public insurance had ever been diagnosed with ADHD compared with 5.7% of uninsured children.
Among children aged 6–11, the prevalence of diagnosed ADHD was similar between uninsured children (6.7%) and children with private insurance (8.0%). However, among those aged 12–17, prevalence among uninsured children (5.7%) was lower than among children with private insurance (11.1%).
Figure 4. Children aged 4–17 years with diagnosed ADHD, by age and poverty status: United States, 2011–2013
1Significantly different from children at 200% or more of the federal poverty level within the same age group (p < 0.05).
NOTES: Data are based on household interviews of a sample of the civilian noninstitutionalized U.S. population. Poverty status is defined by family income as a percentage of the federal poverty threshold. ADHD is attention deficit hyperactivity disorder.
SOURCE: CDC/NCHS, National Health Interview Survey, 2011–2013.
Among those aged 4–5, 3.7% of children in families with incomes less than 200% of the federal poverty threshold had ever been diagnosed with ADHD compared with 1.9% of children in families with incomes at 200% or more of the poverty threshold (Figure 4).
For those aged 6–11, 11.1% of children in families with incomes less than 200% of the federal poverty threshold had ever been diagnosed with ADHD compared with 8.1% of children in families with incomes at 200% or more of the poverty threshold.
Among children aged 12–17, there was no statistically significant difference in the prevalence of diagnosed ADHD by federal poverty status: 12.3% among those in families with incomes less than 200% of the poverty threshold and 11.5% among those in families with incomes at 200% or more of the poverty threshold.
In 2011–2013, 9.5% of U.S. children aged 4–17 had ever been diagnosed with ADHD. This report adds to existing research by examining the relationship between selected demographic and socioeconomic characteristics and diagnosed ADHD for all children aged 4–17 and children in three age groups: 4–5, 6–11, and 12–17. In all three age groups, the prevalence of diagnosed ADHD for boys was greater than the prevalence reported for girls. In contrast, the prevalence of diagnosed ADHD by race and Hispanic ethnicity indicates that differences among these groups varied depending on a child’s age group. Among children aged 4–5, there were no significant racial and ethnic differences in the prevalence of diagnosed ADHD. But among children aged 6–11, the prevalence of diagnosed ADHD was significantly higher among non-Hispanic white children compared with Hispanic children. And among children aged 12–17, prevalence was significantly higher among non-Hispanic white children compared with both non-Hispanic black and Hispanic children.
The scope of this report is limited because the data only describe differences in the prevalence of ever diagnosed ADHD and do not indicate variations in the prevalence of undiagnosed ADHD. A previous study that included parent reports of ADHD symptoms as well as previous diagnoses estimated that slightly less than one-half of children meeting the DSM-IV ADHD criteria had been diagnosed by a health care professional (5). Also, the higher prevalence among older children reflects the longer exposure of older children to the possibility of ever being diagnosed with ADHD.
Another limitation of this study was the use of parent reports to estimate the prevalence of diagnosed ADHD. British and U.S. research, however, has shown parent reports to be valid and reliable when compared with service records (6,7). Data from the National Health Interview Survey (NHIS) provide consistently collected information about diagnosed ADHD that can be used to describe important demographic and socioeconomic differences in this frequently diagnosed health condition among children. In view of the economic and social costs associated with ADHD and the potential benefits of treatment, the continued surveillance of diagnosed ADHD is warranted (8).
Diagnosed attention deficit hyperactivity disorder (ADHD): Respondents were asked, “Has a doctor or health professional ever told you that [sample child] had attention deficit hyperactivity disorder (ADHD) or attention deficit disorder (ADD)?†The condition of diagnosed ADHD does not include children with the symptoms of ADHD who have not received a diagnosis of ADHD from a doctor or health professional.
Health insurance: Respondents were asked about the sample child’s health insurance coverage at the time of the interview. Respondents reported whether the child was covered by private health insurance (obtained through the employer or workplace, purchased directly, or purchased through a local or community program); Medicare; Medicaid; Children’s Health Insurance Program (CHIP); Indian Health Service (IHS); military insurance (including TRICARE); a state-sponsored health plan; another government program; or any single-service plan. This information was used to form three mutually exclusive categories: children with private health insurance, which includes children with TRICARE or other military coverage (some children with private health insurance coverage may also have public health insurance like Medicare); children with only public health insurance, which primarily includes children with Medicaid or CHIP; and children who are uninsured. Children who only had IHS or a single-service plan were considered to be uninsured.
Poverty status: Family income as a percentage of the federal poverty threshold. The federal poverty threshold is based on a set of income thresholds that vary by family size and composition (the number of children in the family, and, for families with two or fewer adults, the age of the adults in the family). The income thresholds are updated annually by the U.S. Census Bureau to reflect changes in the Consumer Price Index for all urban consumers (9). Both reported and imputed income are used to calculate poverty status (10).
Race and Hispanic ethnicity: The revised 1997 Office of Management and Budget standards for race were used for the classification of race and Hispanic ethnicity. A person’s race is described by one or more of five racial groups: white, black or African American, American Indian or Alaska Native, Asian, and Native Hawaiian or Other Pacific Islander. Data on race and Hispanic ethnicity are collected separately but combined for reporting. Not shown separately are data for American Indian or Alaska Native, Asian, Native Hawaiian or Other Pacific Islander, and persons of two or more races. Persons of Hispanic origin may be of any race.
This analysis used data from the 2011–2013 NHIS. Interviewers from the U.S. Census Bureau collect NHIS data continuously throughout the year for the Centers for Disease Control and Prevention’s National Center for Health Statistics. NHIS includes questions about the health and health care of the civilian noninstitutionalized U.S. population. Interviews are conducted in respondents’ homes. In some instances, follow ups to complete interviews may be conducted over the telephone. Questions for this analysis are from the household composition section and the Family Core and Sample Child components of the 2011–2013 NHIS. A sample child is randomly selected from each family in NHIS, and information about the sample child is obtained from an adult residing in the household who is knowledgeable about the child’s health. From 2011 through 2013, information on the sample child was collected for 29,968 children aged 4–17. For more information about NHIS, visit its website.
NHIS is designed to yield a nationally representative sample, and this analysis uses weights to produce nationally representative estimates. Data weighting procedures are described in more detail elsewhere (11). Point estimates and estimates of corresponding variances for this analysis were calculated using the SUDAAN software package (12) to account for the complex sample design of the survey. The Taylor series linearization method was chosen for variance estimation. Estimates shown in this report that do not meet the current NHIS standard of statistical reliability (relative standard error less than or equal to 30%) are indicated by an asterisk (*). Differences between percentages were evaluated using two-sided significance tests at the 0.05 level.
Patricia N. Pastor, Cynthia A. Reuben, Catherine R. Duran, and LaJeana D. Hawkins are with CDC’s National Center for Health Statistics, Office of Analysis and Epidemiology.
Pastor PN, Reuben CA, Duran CR, Hawkins LD. Association between diagnosed ADHD and selected characteristics among children aged 4–17 years: United States, 2011–2013. NCHS data brief, no 201. Hyattsville, MD: National Center for Health Statistics. 2015.
All material appearing in this report is in the public domain and may be reproduced or copied without permission; citation as to source, however, is appreciated.
Charles J. Rothwell, M.S., M.B.A., Director
Nathaniel Schenker, Ph.D., Deputy Director
Jennifer H. Madans, Ph.D., Associate Director for Science
Irma E. Arispe, Ph.D., Director
To view HUNDREDS of articles and videos on ADD/ADHD, go to addrc.org
support@addrc.org 646/205.8080
Harold Robert Meyer | The ADD Resource Center 07/03/2025 Executive Summary Couples where one or…
July 01, 2025 by addrcHarold Robert Meyer and The ADD Resource Center Why are people…
Why is it that even after we’ve made peace with someone’s actions, the memory lingers?…
Knowing that ADHD is manageable flips the script from despair to possibility. It’s not just…
If you care about your cognitive health or that of your children, understanding the impact…
As a teen with ADHD, you're navigating school, friendships, family expectations, and your own identity—all…